The core concept is to communicate the OMSZ's activities and impact in 2016 in an accessible and engaging way through the infographic, while also providing a practical tool (the resuscitation flowchart) to aid emergency dispatchers. The project aims to inform the public, enhance transparency, and potentially improve emergency response outcomes.
challenge
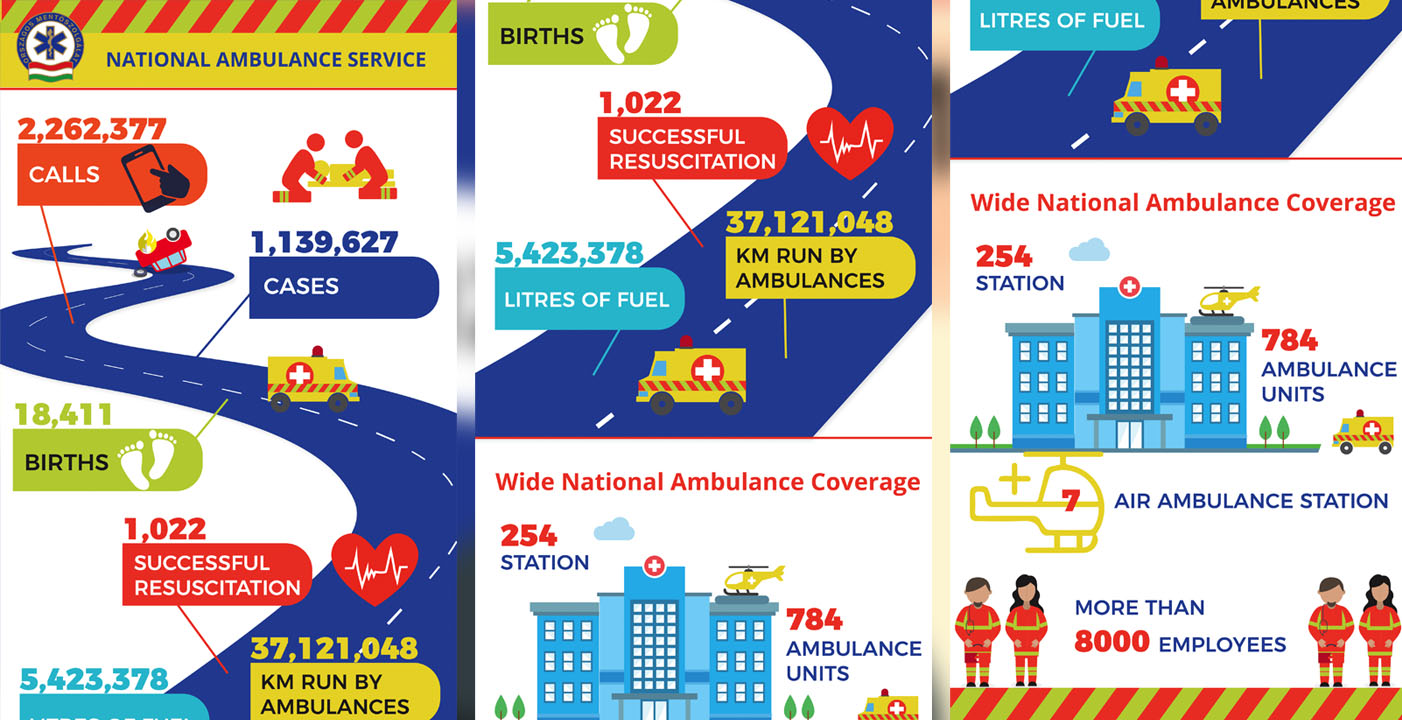
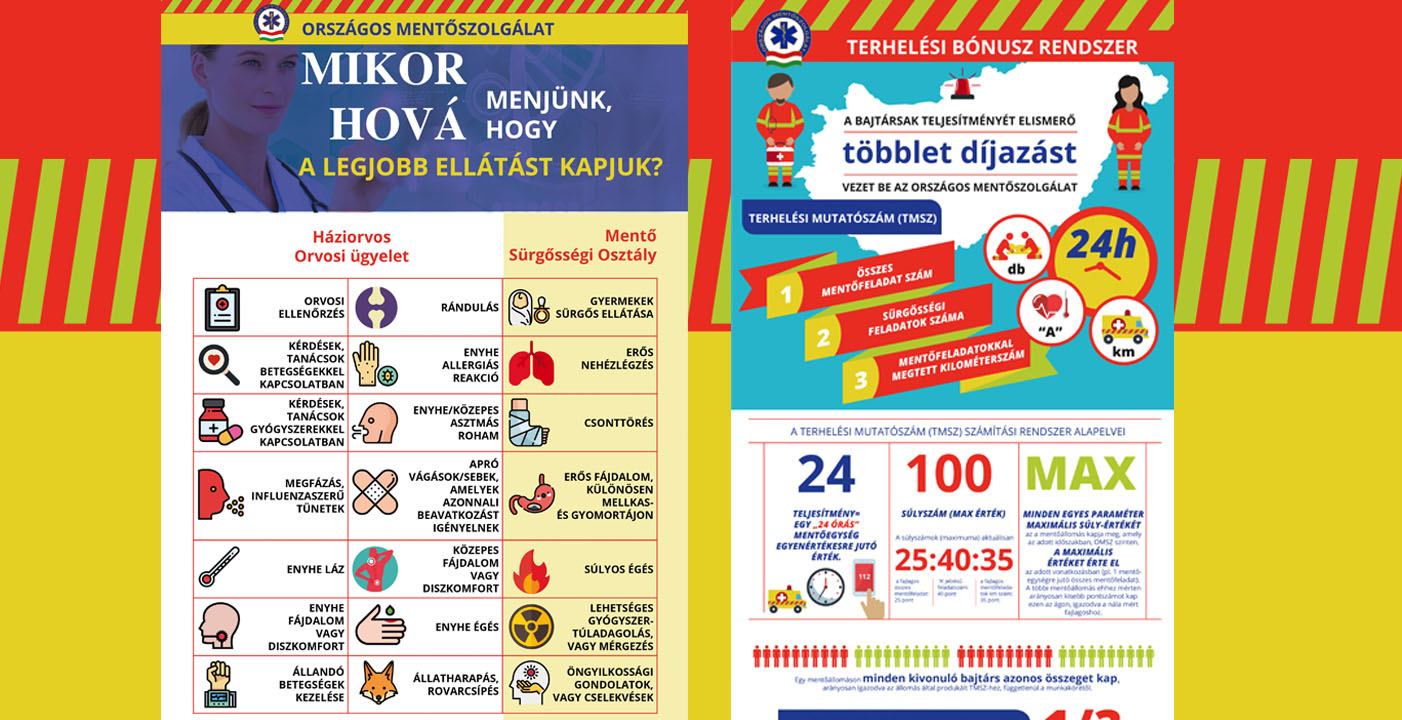
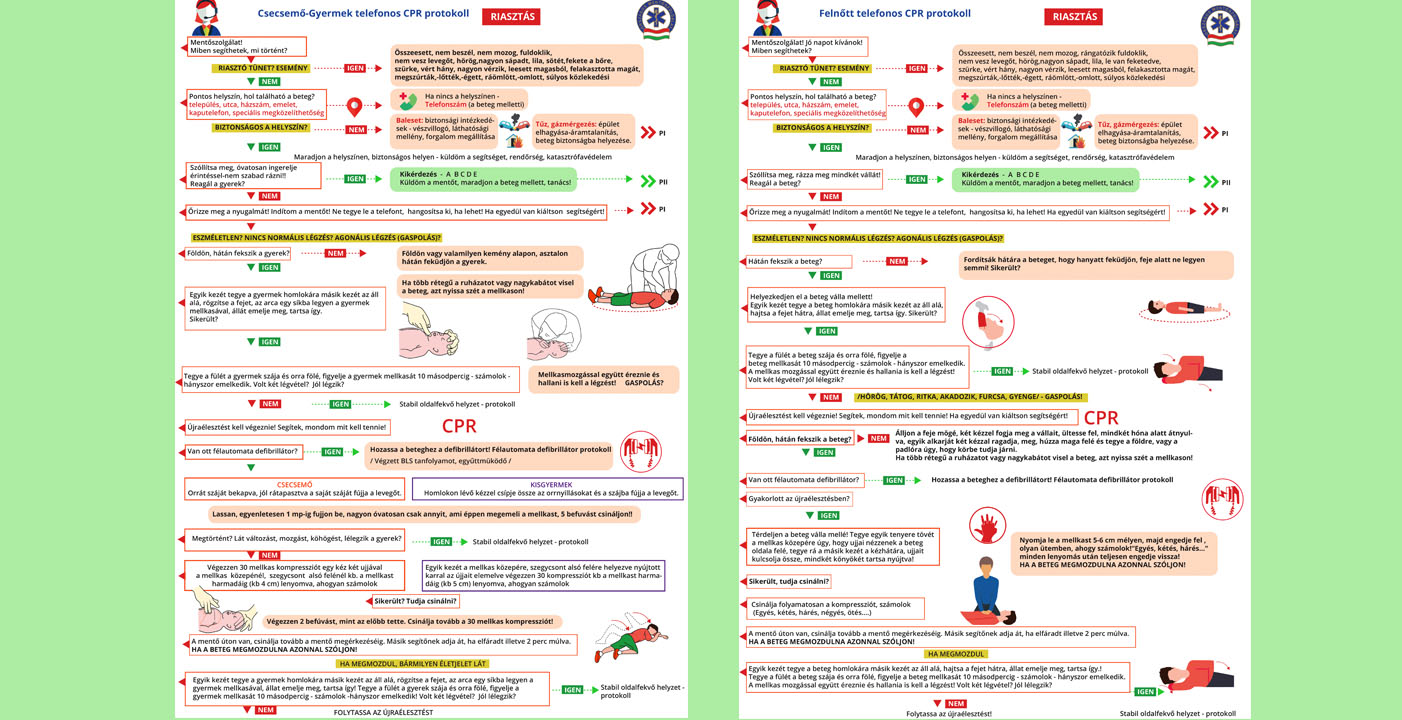
Presenting complex statistical data in a visually appealing and easy-to-understand infographic is a significant challenge. It needs to be informative without being overwhelming. The resuscitation flowchart must be clear, concise, and easy to follow in high-stress situations. Ambiguity or complexity could lead to delays or mistakes.
solution
Using playful illustrations makes the data more approachable and less intimidating, especially for a general audience. It can help to humanize the statistics and make them more memorable.
publish date
jan 12, 2016
project type
inforaphics
client
Emergency Services Hungary | OMSZ
preparedness saves lives: learn about the work of the hungarian national ambulance service
Using playful illustrations makes the data more approachable and less intimidating, especially for a general audience. It can help to humanize the statistics and make them more memorable.
Both the infographic and the flowchart have been tested with target users to gather feedback and make any necessary changes before release.